🚚 Free Worldwide Shipping on All Orders!Shop Now

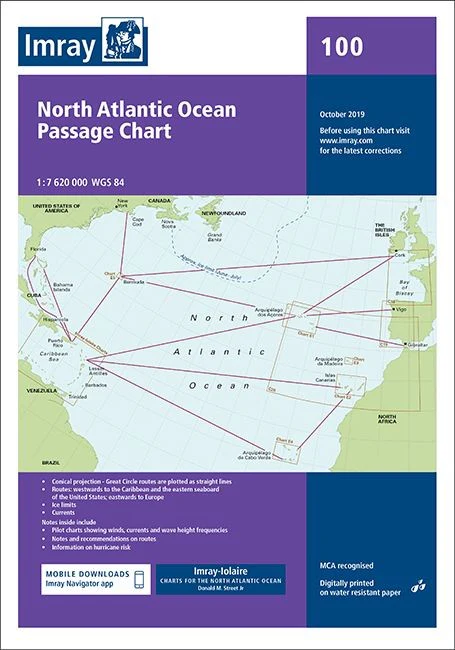
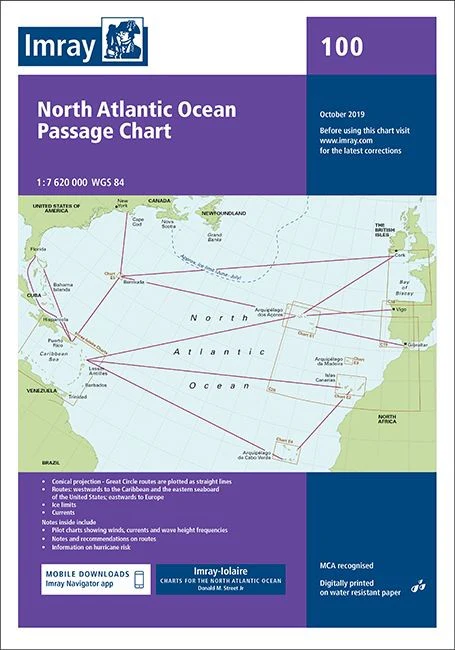
Imray Chart 100 - North Atlantic Ocean Passage Chart
Imray 100 - North Atlantic Ocean Passage Chart
The award winning Imray navigational charts allow for easy chart plotting in any conditions.
This edition of the 100 paper chart is printed and corrected to October 2019.
- Digitially printed on water resitant paper & folded to A4 size in a plastic wallet - open size: 79 x 112cm
- Chart scale 1:7 620 000
- WGS 84
- MCA recognised
- Detailed cartography using up-to-date official survey data, with the latest depth surveys applied
- Contains tidal stream information including direction and rates
- Includes a separate sheet of information with any symbols & abbreviations used on Imray charts
- The chart specification has been improved to show coloured light flashes
- Latest chart corrections available on the Imray website
- With a scale of 1:7 620 000, Chart 100 covers from Brazil to Newfoundland and Gibraltar to the Caribbean
- Constructed on a conical projection that means that Great Circle tracks can be plotted as straight lines rather than curves
- Shows the main trend of depth contours, limits of ice, magnetic variations and key routes
$37.47
Imray Chart 100 - North Atlantic Ocean Passage Chart—
$37.47
Product Information
Product Information
Shipping & Returns
Shipping & Returns
Description
Imray 100 - North Atlantic Ocean Passage Chart
The award winning Imray navigational charts allow for easy chart plotting in any conditions.
This edition of the 100 paper chart is printed and corrected to October 2019.
- Digitially printed on water resitant paper & folded to A4 size in a plastic wallet - open size: 79 x 112cm
- Chart scale 1:7 620 000
- WGS 84
- MCA recognised
- Detailed cartography using up-to-date official survey data, with the latest depth surveys applied
- Contains tidal stream information including direction and rates
- Includes a separate sheet of information with any symbols & abbreviations used on Imray charts
- The chart specification has been improved to show coloured light flashes
- Latest chart corrections available on the Imray website
- With a scale of 1:7 620 000, Chart 100 covers from Brazil to Newfoundland and Gibraltar to the Caribbean
- Constructed on a conical projection that means that Great Circle tracks can be plotted as straight lines rather than curves
- Shows the main trend of depth contours, limits of ice, magnetic variations and key routes